1 The Data Science Workflow
This playbook applied the data science workflow in R for Data Science (2e) (Wickham et al., 2023) to help researchers examine public health problems from a biopsychosocial perspective. Specifically, researchers may use these plays to examine the prevalence of disease and wellbeing indicators, describe health patterns, identify associations between (risk/protective/promotive) determinants and (positive/negative) health outcomes, and create a reproducible scientific report with R and Quarto.
By the end of this guide, you will be able to:
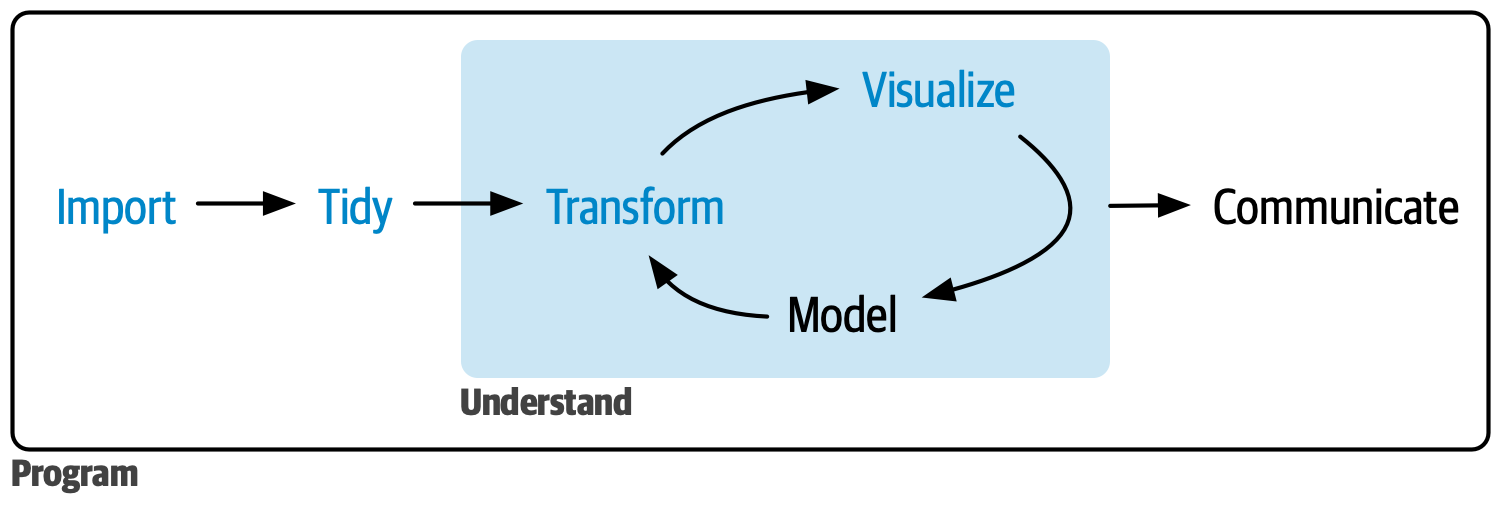
- Import - Load data from various files, such as text (.csv), excel (.xlsx), and SPSS (.sav)
- Tidy - Organize data into a consistent, analysis-ready structure using
tidyr - Transform - Clean, recode, and create new variables using
dplyrandpsych - Visualize - Create informative graphs and charts with
ggplot2 - Model - Apply statistical methods (e.g., regression, paired t-test) to answer questions
- Communicate - Generate reproducible reports with Quarto to advance transparent scientific practices and multiple products (e.g., report, manuscript, presentation)
Each section builds on previous concepts, taking you from raw data files to a publication-ready, reproducible scientific report.
1.1 What Makes This Guide Different?
- Interactive Learning: Some code examples can be copy and pasted into your .R script, .qmd markdown report file, or run in the console. Some chapters include code examples that run directly in your browser using WebR—no software installation required
- Real Public Health Data: Examples use datasets on insurance claims from kaggle, oral health and diabetes (cohort 10), health beliefs (cohort 11), and related surveys
- Complete Workflow: Covers every step from raw data to publication-ready reports
- Practical Focus: Emphasizes “plays” (R code chunks) you’ll actually use in public health research and practice
1.2 Prerequisites
Technical Requirements:
A web browser (Chrome, Firefox, Safari, or Edge) for interactive WebR examples
Posit Cloud in a browser or R/R Studio on your computer
Background Knowledge:
Basic familiarity with public health concepts
Introductory statistics (descriptive statistics, hypothesis testing, p-values)
Motivation to learn more R programming (with limited R experience!)
1.3 How to Cite This Guide
You can cite this guide as:
McCarty, S. (Ed.). (2025). The Quantitative Playbook for Public Health Research in R. https://shanemccarty.github.io/FRIplaybook/
Or, you can cite a specific chapter:
Silhavy, A. & McCarty, S. (2025). Visualizing data in ggplot2: How to produce publication-ready plots. The Quantitative Playbook for Public Health Research in R. https://shanemccarty.github.io/FRIplaybook/ggplot2.html