16 The Analysis Map
How to get from your research question to your plot and your statistical test
This chapter gives researchers a map for planning their data analysis. Starting from a research question, researchers follow four steps: describe the data and check whether the outcome is normally distributed, decide whether the question is a comparison or a relationship, visualize the data, and choose the statistical test, where every box on the map has two lines, a parametric test for normal data and a non-parametric test for data that are not. The chapter explains the difference between comparative and relationship research, reviews the types of data (nominal, ordinal, discrete, continuous) and where a 1-to-6 Likert item or composite lands, quizzes researchers on five questions from the lab dataset, and ends with the past-tense Data Analysis Plan paragraph for the Methods section of the RD Report and Final Report. Every name in blue is a chapter in this playbook.
data analysis plan, decision tree, comparative research, relationship research, data types, normality
16.1 The Map
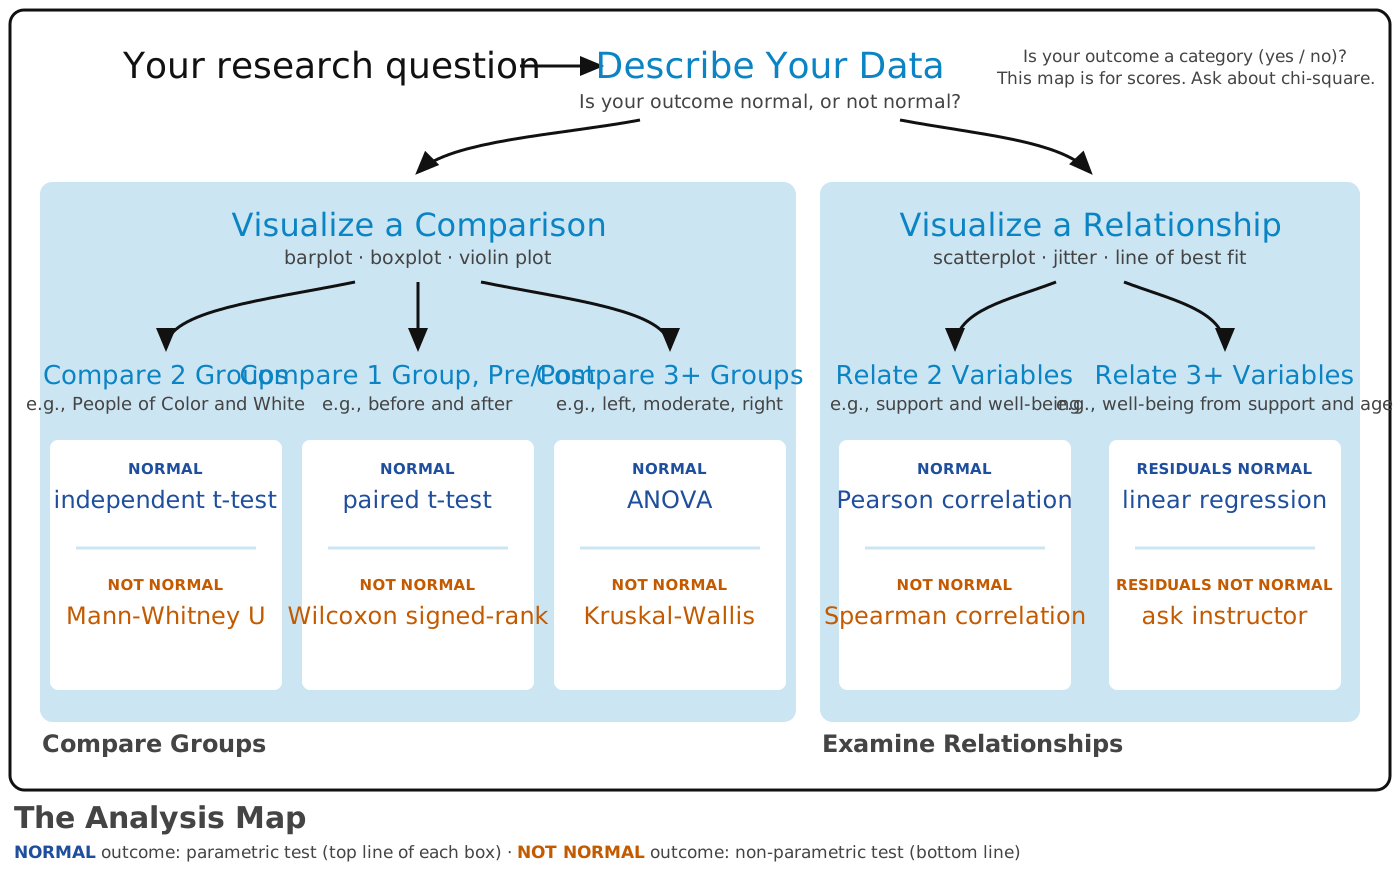
Click the map to make it bigger.
16.2 How to Read the Map
Start at the top left with your research question, and follow the arrows. Every name in blue is a chapter in this playbook. There are four steps.
- Describe Your Data. Make a descriptives table and a histogram of the outcome (the score) in your research question. Decide whether the histogram is roughly bell-shaped (normal) or not. Remember your answer. You will need it at step 4.
- What kind of question is it? Decide whether you are comparing groups or examining a relationship (see below).
- Visualize. Make the plot that fits your question: Visualize a Comparison or Visualize a Relationship. Always look at your data before you test it.
- Choose your test. Find the box that matches your question. Each box lists two tests, in two colors. If your outcome is normal, use the first one, in navy: the parametric test. If your outcome is not normal, use the second one, in orange: the non-parametric test. The same two colors mark the two tests in every chapter from here on.
Every test on the map needs an outcome that is a score (a continuous variable), such as a composite from 1 to 5. If your outcome is a category, such as yes or no, you need a different test (chi-square). Talk to your peer mentor and/or Dr. Shane.
16.3 Comparison or Relationship?
Your research question can be classified as comparative research or relationship research (Barroga & Matanguihan, 2022).
16.3.1 Comparison Research
Comparative research questions examine mean score differences on a continuous (quantitative) variable based on real or artificial (researcher-decided) group membership. Simply put, comparative research offers a way of comparing different categories to one another. These categories can be:
🏷️ Nominal Data (Racial/Ethnic Identity)
- American Indian/Alaska Native
- Asian
- Black/African American
- Hispanic/Latinx
- Middle Eastern/North African
- Native Hawaiian/Pacific Islander
- White
- Two or more
📶 Ordinal Data (Age Group)
- 18 - 35
- 36 - 54
- 55 - 75
- 76+
16.3.2 Relationship Research
For relationship research, the variables are 📏 Continuous because they range along a continuum, such as a scale for beliefs from 1 (strongly disagree) to 6 (strongly agree). to build a custom scatterplot.
16.4 Understanding Data Types
To read the map, you need to know what type of data each of your variables is:
Qualitative Data:
🏷️ Nominal Data: Categories without any order (e.g.,
RACIALIZED,GENDER, Red / Green / Blue)📶 Ordinal Data: Categories with an order but no fixed distance between them (e.g., Small / Medium / Large; a single Likert item such as How confident are you in your cooking? from 1 = Not at all to 6 = Extremely)
Quantitative Data:
🔢 Discrete: Countable data (e.g., number of people in a room, number of cooking skills a person knows out of 5)
📏 Continuous: Measurable data (e.g., height, weight, age, a Veggie Meter score)
Most of your survey data are Likert items on a 1-to-6 scale (1 = Strongly disagree … 6 = Strongly agree, or 1 = Not at all … 6 = Extremely). Where they land depends on how many you have:
One item on its own is ordinal. The numbers are ordered, but the distance from 1 to 2 is not necessarily the same as from 5 to 6, and a mean of 3.4 is not an answer anyone gave. Treat a single item as a category when it is a predictor or a group (recode it with
case_when()in Transforming Your Data), and use the non-parametric line of the map’s box when it is the outcome (Mann-Whitney U, Wilcoxon signed-rank, Kruskal-Wallis, Spearman).A composite of several items is treated as continuous. When you average four or more related items (Create Composite Variables), the score can take many values between 1 and 6 and usually looks roughly normal, so a composite outcome follows the parametric line of the box (t-test, ANOVA, Pearson, regression), after you check its shape in Describe Your Data.
So the question to ask of every outcome on your map is not “is it Likert?” but “is it one item or a composite, and what does its distribution look like?”
Update the data types (the #1a, 1b, 2a, 2b Var columns) and the analysis (e.g., Ind T-test, Paired T-test) for both questions in the SHARED Research Questions google sheet.
16.5 🏈 The Lab

Ref’s kickoff. There is no code in this lab. Consider this a quiz on what you just learned. Read each of the five research questions about the lab dataset and write down comparison or relationship for each one, along with the box on the map it lands in. Then click Ref’s check to view the answers.
- Is age (
AGE) related to the belief that substance use causes mental illness (MIAQ_SUBSTANCE)? - Is mental health stigma (
STIGMA) related to mental health self-efficacy (EFFICACY)? - Does the belief that mental health is social (
SOCIAL) differ between people on the political left, moderates, and people on the political right? - Does willingness to seek help (
HELPSEEK) differ between women and men? - Did stigma (
STIGMA) change between the first survey and the follow-up survey for the same people?
Ref’s check: where does each question land on the map?
- Relationship, Relate 2 Variables. Both variables are scores;
AGEis skewed in a student sample, so expect the Spearman line. - Relationship, Relate 2 Variables. Both variables are composites, so expect the Pearson line if their histograms are bells.
- Comparison, Compare 3+ Groups. The groups are left, moderate, and right. The outcome is a score.
- Comparison, Compare 2 Groups. Women and men are different people.
HELPSEEKis a single 1-to-5 item, so it counts as not normal: use the second test in the box, Mann-Whitney U. - Comparison, Compare 1 Group, Pre/Post. The same people answered before and after.
Ref’s final whistle. That is the end of the lab. You will make the plots for questions 1, 2, and 3 in the two visualize chapters.
16.6 🏆 Your Turn
You already submitted a Methods section in your AIM Report. The next drafts you submit are the RD Report and then the Final Report, and in both the Data Analysis Plan is the last subheading and the last text in your Methods section. Update it now using the map, and keep updating it as you run the analyses: by the Final Report it needs to be a detailed account of what you did, so write it in the past tense, as a description of the analysis you ran, not the one you intend to run. (In the RD Report you may not have run every test yet. Write the ones you have run in the past tense and mark the rest with a bracketed note to yourself, such as [to run after Lab 5], and remove the brackets in the Final Report.)
Do this once for each of your research questions. Copy the sentences below into your Data Analysis Plan and fill in the blanks.
The research aims to answer a ________ (comparison / relationship) question: ________. The outcome was ________, a ________ (composite score of __ items / single item / count / measurement) treated as a ________ (continuous / ordinal) variable. The ________ (grouping variable / second variable) was ________, a ________ (nominal / ordinal / continuous) variable with ________ (levels / range).
On the Analysis Map, this question landed in the box ________. The data were visualized with a ________ (bar chart / violin plot / raincloud plot / scatterplot). The distribution of the outcome was ________ (approximately normal / not normal) (Shapiro-Wilk p = ____), so the ________ test was used, with ________ (Cohen’s d / r / η² / R²) as the effect size. Analyses were run in RStudio (version ____) using the ________ packages.
In RStudio, click Help > About RStudio (Mac: RStudio > About RStudio); the version is on the first line, such as 2025.09.1. For the version of R itself, run R.version.string in the Console, which prints something like R version 4.4.1. Both change when you update, so look them up when you write the Final Report, not from memory.
A worked example of the finished paragraph, using question 4 from the Lab above (willingness to seek help by gender in the lab dataset):
The research aims to answer a comparison question: does willingness to seek help differ between women and men? The outcome was willingness to seek help (
HELPSEEK), a single item treated as an ordinal variable. The grouping variable was gender (GENDER), a nominal variable with two levels (women, men). On the Analysis Map, this question landed in the box Compare 2 Groups. The data were visualized with a violin plot. The distribution of the outcome was not normal (Shapiro-Wilk p < .001), so the Mann-Whitney U test was used, with r as the effect size. Analyses were run in RStudio (version 2025.09.1) using the tidyverse and ggpubr packages.
16.7 Many Models, One Short List
The Analysis Map is short on purpose. In The Model Thinker, Scott Page (2018) argues that data does not explain itself. People move from data to information, from information to knowledge, and from knowledge to wisdom by using models: simplified, formal ways of describing how something works. Every model leaves things out, so no single model is ever the full story. Page’s advice is to become a many-model thinker: learn several models, know what each one assumes, and look at the same problem through more than one of them.
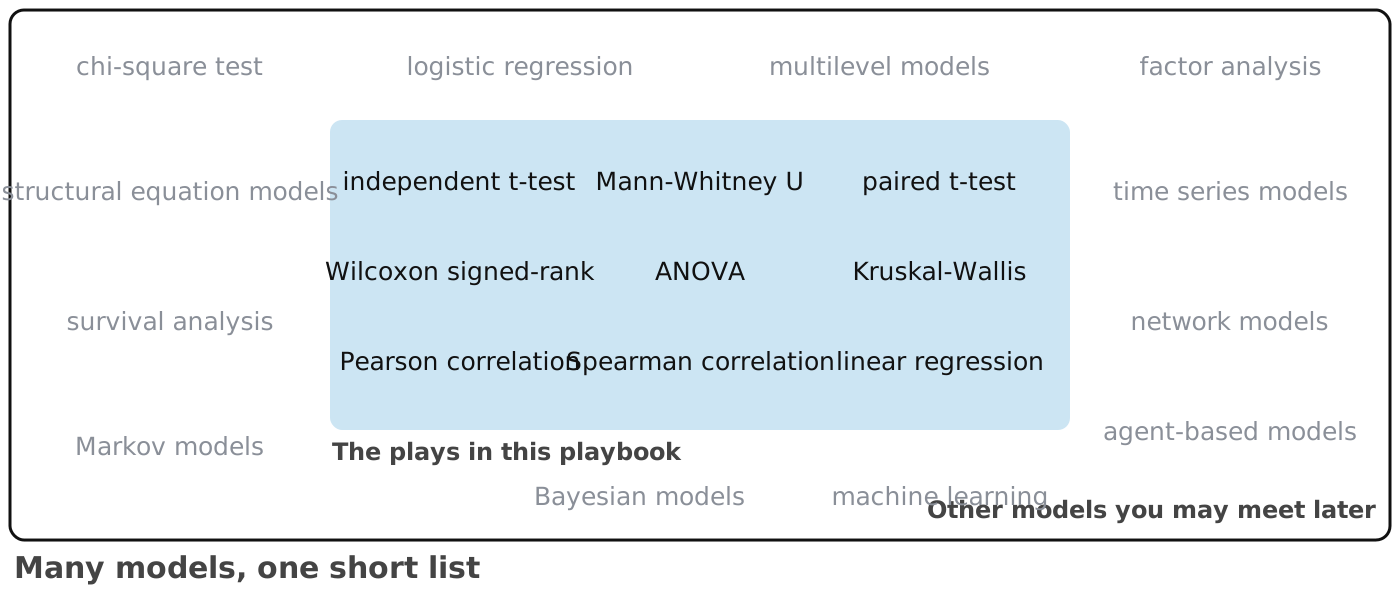
The statistical tests on the Analysis Map are models, too. A t-test is a model of two groups. A regression is a model of a straight line. They are the right models for the research questions in this course, and they are the only ones you will choose from for your RD Report and Final Report. They are not the only ones that exist. Logistic regression, multilevel models, network models, machine learning, and many others answer questions that these tests cannot. If your question does not fit the map, that does not mean it is a bad question. It means it needs a different model, so talk to your peer mentor and/or Dr. Shane. You can find places to keep learning in Statistics.
Reference
Page, S. E. (2018). The model thinker: What you need to know to make data work for you. Basic Books.